在开发用的测试集群上用 Helm 安装 NebulaGraph
先决条件
用 kind 创建一个测试用的 Kubernetes 集群
编写一个 kind.yaml 文件,然后指定一下配置:
kind: Cluster
name: nebula-graph
apiVersion: kind.x-k8s.io/v1alpha4
nodes:
- role: control-plane
- role: worker
  extraPortMappings:
  # 提前分配好 NebulaGraph 自己的端口 #
  - containerPort: 30101
    hostPort: 30101
    protocol: TCP
  # 提前分配好 NebulaGraph Studio 的端口 #
  - containerPort: 30102
    hostPort: 30102
    protocol: TCP
用 kind 根据配置文件创建
kind create cluster --config ./kind.yaml创建之后应该可以用 kind 看到
❯ kind get clusters
nebula-graph
这个时候 kubectl 用的配置文件这个时候也应该已经写入和准备好了,直接执行下面的命令就可以获得节点状态
kubectl get nodes这个时候应该可以看到这样的输出
❯ kubectl get nodes
NAME                         STATUS   ROLES           AGE     VERSION
nebula-graph-control-plane   Ready    control-plane   4d22h   v1.27.3
nebula-graph-worker          Ready    <none>          4d22h   v1.27.3
确认无误后就可以继续后面的步骤了
添加 Helm Chart
按照 NebulaGraph 官方文档的介绍,要用 Helm 管理和部署 NebulaGraph 集群到 Kubernetes 的话,需要安装 Operator。
添加一下 Operator 的 Helm Chart
helm repo add nebula-operator https://vesoft-inc.github.io/nebula-operator/charts更新一下 Repo 引用
helm repo update这个时候用
helm repo list应该可以看到这些 repo
❯ helm repo list
NAME           	URL
nebula-operator	https://vesoft-inc.github.io/nebula-operator/charts
安装 NebulaGraph 的 Operator
运行这个命令应该就能自动创建 Namespace 并且安装管理 NebulaGraph 集群用的 NebulaGraph Operator 了:
helm install nebula-operator nebula-operator/nebula-operator --namespace=nebula-operator-system --create-namespace切换到 NebulaGraph 的 Operator 所在的 Namespace 下:
kubectl config set-context --current --namespace nebula-operator-system这个时候应该可以看到这样的输出
❯ helm list
NAME           	NAMESPACE             	REVISION	UPDATED                             	STATUS  	CHART                	APP VERSION
nebula-operator	nebula-operator-system	1       	2023-12-29 10:14:05.534035 +0800 CST	deployed	nebula-operator-1.7.3	1.7.3
用 get pods 看看运行状态吧:
kubectl get pods应该会有类似的输出
❯ kubectl get pods
NAME                                                             READY   STATUS    RESTARTS       AGE
nebula-operator-controller-manager-deployment-56c84fd68f-lnr85   2/2     Running   2 (107m ago)   4d5h
nebula-operator-controller-manager-deployment-56c84fd68f-vz54m   2/2     Running   4 (107m ago)   4d5h
nebula-operator-scheduler-deployment-6bf5cf6fc9-sx47x            1/1     Running   2 (107m ago)   4d5h
nebula-operator-scheduler-deployment-6bf5cf6fc9-xq46m            1/1     Running   2 (107m ago)   4d5h
看看 NebulaGraph 的 CRD(Custom Resources) 有没有装上了
kubectl get crd应该会有类似的输出
❯ kubectl get crd
NAME                                            CREATED AT
nebulaautoscalers.autoscaling.nebula-graph.io   2023-12-29T02:14:03Z
nebulaclusters.apps.nebula-graph.io             2023-12-29T02:14:03Z
nebularestores.apps.nebula-graph.io             2023-12-29T02:14:03Z
通过 NebulaGraph Operator 创建集群
在创建之前我们需要了解一下期望安装的 NebulaGraph 集群在创建 Kubernetes 硬盘和存储卷资源的时候所使用的 Storage Class 是什么:
kubectl get sc❯ kubectl get sc
NAME PROVISIONER RECLAIMPOLICY VOLUMEBINDINGMODE ALLOWVOLUMEEXPANSION AGE
standard (default) rancher.io/local-path Delete WaitForFirstConsumer false 4d22h什么是 `sc` 和 Storage Class?
sc 代表了 Storage Class,对于使用 kind 创建的集群而言,默认填写 standard 就可以了。
接下来,和创建 NebulaGraph Operator 一样,用 Helm 安装一个 NebulaGraph 集群
helm install "nebula" \
	nebula-operator/nebula-cluster \
	--namespace="nebula" \
	--set nameOverride=nebula \
	--set nebula.storageClassName="standard"
	--create-namespace
切换到 NebulaGraph 集群所在的 Namespace 下:
kubectl config set-context --current --namespace nebula-operator-system这个时候应该可以看到这样的输出
❯ helm list
NAME         	NAMESPACE	REVISION	UPDATED                             	STATUS  	CHART               	APP VERSION
nebula       	nebula   	1       	2023-12-29 11:10:27.293253 +0800 CST	deployed	nebula-cluster-1.7.3	1.7.3
老样子,检查一下 Pod 运行状态
kubectl get pods这个时候应该可以看到这样的输出
❯ kubectl get pods
NAME                              READY   STATUS    RESTARTS       AGE
nebula-exporter-c4bd8556b-jt2jk   1/1     Running   1 (122m ago)   4d5h
nebula-graphd-0                   1/1     Running   1 (122m ago)   4d5h
nebula-graphd-1                   1/1     Running   1 (122m ago)   4d5h
nebula-metad-0                    1/1     Running   1 (122m ago)   4d5h
nebula-metad-1                    1/1     Running   1 (122m ago)   4d5h
nebula-metad-2                    1/1     Running   1 (122m ago)   4d5h
nebula-storaged-0                 1/1     Running   1 (122m ago)   4d5h
nebula-storaged-1                 1/1     Running   1 (122m ago)   4d5h
nebula-storaged-2                 1/1     Running   1 (122m ago)   4d5h
安装可视化客户端 NebulaGraph Studio
克隆一下 NebulaGraph Studio 的客户端
git clone [email protected]:vesoft-inc/nebula-studio.git切换到 nebula-studio 下面的 deployment/helm 目录里面
cd nebula-studio/deployment/helm因为我们是开发和测试用的,安装之前记得修改成 SQLite3 作为数据持久化方案,如果有别的数据库实例,可以改成自己的 MySQL 实例的地址(比如 Kubernetes 部署的 MySQL):
apiVersion: v1
kind: ConfigMap
metadata:
  name: {{ include "nebula-studio.name" . }}-config
data:
  studio-api.yaml: |
    Name: studio-api
    Host: 0.0.0.0
    Port: 7001
    MaxBytes: 1073741824
    Timeout: 60000
    Log:
      Mode: file
      Level: error
      KeepDays: 7
    Debug:
      Enable: false
    Auth:
      TokenName: "studio_token"
      AccessSecret: "login_secret"
      AccessExpire: 259200
    File:
      UploadDir: "/data/upload/"
      TasksDir: "/data/tasks"
    DB:
      # 1,2,3,4 corresponding to Silent, ERROR, Warn, INFO
      LogLevel: 4
      IgnoreRecordNotFoundError: false
      # AutoMigrate run auto migration for given models
      AutoMigrate: true
      # The database backend, either "mysql", "sqlite3".
      Type: "sqlite3" # [!code focus]
      # Database host
      Host: "192.168.8.44:3306"
      # Database name
      Name: "hetao_test"
      # Database user
      User: "root"
      # Database password
      Password: "nebula"
      # For "sqlite3" only, database file path
      SqliteDbFilePath: "./data/tasks.db"
      # The maximum open connections of the pool.
      MaxOpenConns: 30
      # The maximum idle connections of the pool.
      MaxIdleConns: 10
用当前目录的 Helm Chart 定义生成 Kubernetes 资源文件然后原地安装:
helm install nebula-studio --namespace nebula .这个时候应该可以看到这样的输出
❯ helm list
NAME         	NAMESPACE	REVISION	UPDATED                             	STATUS  	CHART               	APP VERSION
nebula       	nebula   	1       	2023-12-29 11:10:27.293253 +0800 CST	deployed	nebula-cluster-1.7.3	1.7.3
nebula-studio	nebula   	1       	2024-01-02 15:23:28.852275 +0800 CST	deployed	nebula-studio-0.1.2 	v3.0.0
老样子,检查一下 Pod 运行状态
kubectl get pods❯ kubectl get pods
NAME READY STATUS RESTARTS AGE
nebula-exporter-c4bd8556b-jt2jk 1/1 Running 1 (123m ago) 4d5h
nebula-graphd-0 1/1 Running 1 (123m ago) 4d5h
nebula-graphd-1 1/1 Running 1 (123m ago) 4d5h
nebula-metad-0 1/1 Running 1 (123m ago) 4d5h
nebula-metad-1 1/1 Running 1 (123m ago) 4d5h
nebula-metad-2 1/1 Running 1 (123m ago) 4d5h
nebula-storaged-0 1/1 Running 1 (123m ago) 4d5h
nebula-storaged-1 1/1 Running 1 (123m ago) 4d5h
nebula-storaged-2 1/1 Running 1 (123m ago) 4d5h
nebula-studio-58f854d7c9-fflzq 1/1 Running 0 63m❯ kubectl get svc
NAME TYPE CLUSTER-IP EXTERNAL-IP PORT(S) AGE
nebula-exporter-svc ClusterIP 10.96.183.159 <none> 9100/TCP 4d5h
nebula-graphd-headless ClusterIP None <none> 9669/TCP,19669/TCP 4d5h
nebula-graphd-svc NodePort 10.96.31.131 <none> 9669:30101/TCP,19669:31873/TCP 4d5h
nebula-metad-headless ClusterIP None <none> 9559/TCP,19559/TCP 4d5h
nebula-storaged-headless ClusterIP None <none> 9779/TCP,19779/TCP,9778/TCP 4d5h
nebula-studio-service ClusterIP 10.96.122.0 <none> 7001/TCP 3s这个时候可以发现 NebulaGraph Studio 并没有可以供外部访问的 NodePort 类型的 Service,还记得之前的 kind.yaml 提前分配的 30102 端口吗?这个时候我们手动暴露一个 NodePort 类型的 Service 给 NebulaGraph Studio 并且修改一下端口就好。
详细的操作背后的逻辑和含义可以在 用 kind 创建的测试集群快速部署应用并暴露 NodePort 服务到宿主机方便调试 一文中阅读了解。
kubectl expose deployment nebula-studio --name=nebula-studio-nodeport --type=NodePort修改 NodePort 端口到 30102
kubectl patch service nebula-studio-nodeport --type='json' --patch='[{"op": "replace", "path": "/spec/ports/0/nodePort", "value":30102}]'查看创建的 NodePort 类型的 Service 的状态
kubectl get svc nebula-studio-nodeport -o wide❯ kubectl get svc nebula-studio-nodeport -o wide
NAME TYPE CLUSTER-IP EXTERNAL-IP PORT(S) AGE SELECTOR
nebula-studio-nodeport NodePort 10.96.36.19 <none> 7001:30102/TCP 29s app.kubernetes.io/instance=nebula-studio,app.kubernetes.io/name=nebula-studio这个时候返回到开发的设备上通过 localhost:30102 就可以访问到了:


配置可视化客户端 NebulaGraph Studio
这个时候我们来配置客户端。
因为 NebulaGraph Studio 是部署在和 NebulaGraph 相同的 Kubernetes 集群中的,所以可以通过 Kubernetes 的内部通信域名访问到服务资源,这个时候可以通过
kubectl get svc查看到当前 Namespace 下面的 Service 资源,我们找到 nebula-graphd-svc 资源就好
❯ kubectl get svc
NAME                       TYPE        CLUSTER-IP      EXTERNAL-IP   PORT(S)                          AGE
nebula-exporter-svc        ClusterIP   10.96.183.159   <none>        9100/TCP                         4d6h
nebula-graphd-headless     ClusterIP   None            <none>        9669/TCP,19669/TCP               4d6h
nebula-graphd-svc          NodePort    10.96.31.131    <none>        9669:30101/TCP,19669:31873/TCP   4d6h
nebula-metad-headless      ClusterIP   None            <none>        9559/TCP,19559/TCP               4d6h
nebula-storaged-headless   ClusterIP   None            <none>        9779/TCP,19779/TCP,9778/TCP      4d6h
nebula-studio-nodeport     NodePort    10.96.36.19     <none>        7001:30102/TCP                   65m
nebula-studio-service      ClusterIP   10.96.122.0     <none>        7001/TCP                         66m
然后填写 Service 的名称到 Graphd IP 地址的字段里,用户名填写 root,默认配置下,密码随便填,就可以通信啦:
| 字段名 | 值 |
|---|---|
| Graphd IP | nebula-graphd-svc |
| 端口 | 9669 |
| 用户名 | root |
| 密码 | 随便填,这里以 123456 为例子 |

进入之后可以通过 Schema 这个标签页创建一个测试用的图空间:

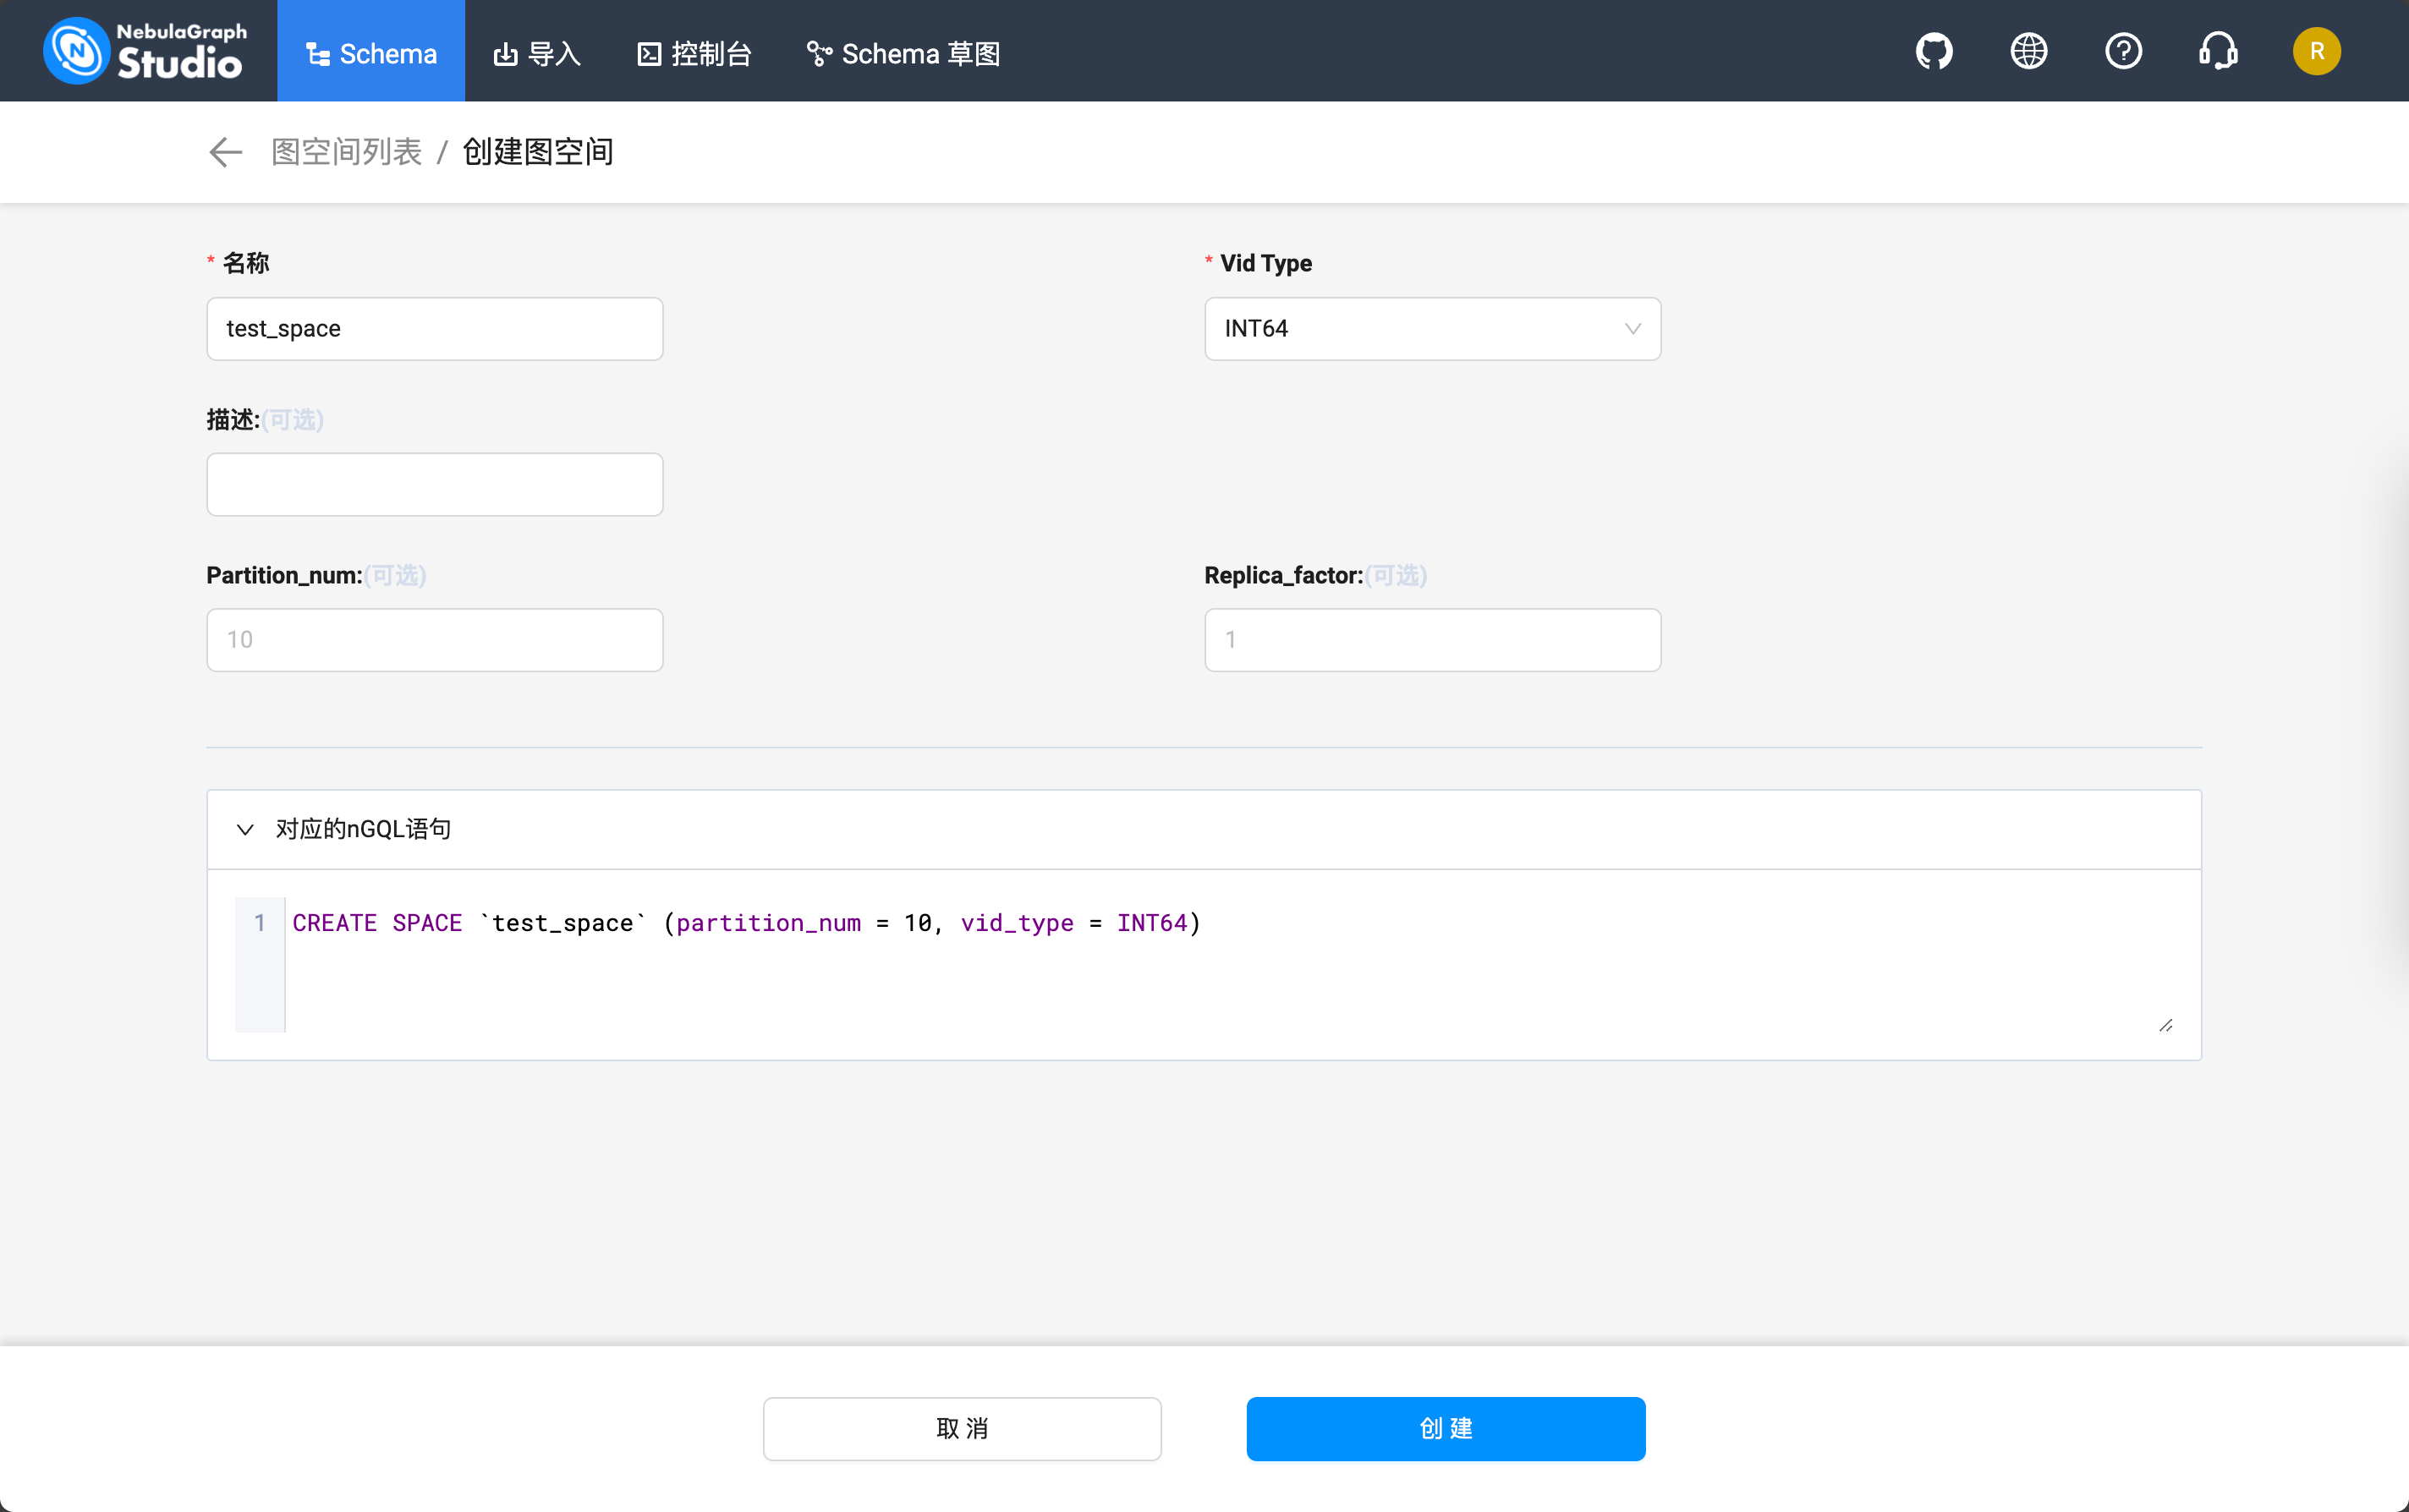
它会生成这样的 nSQL 语句:
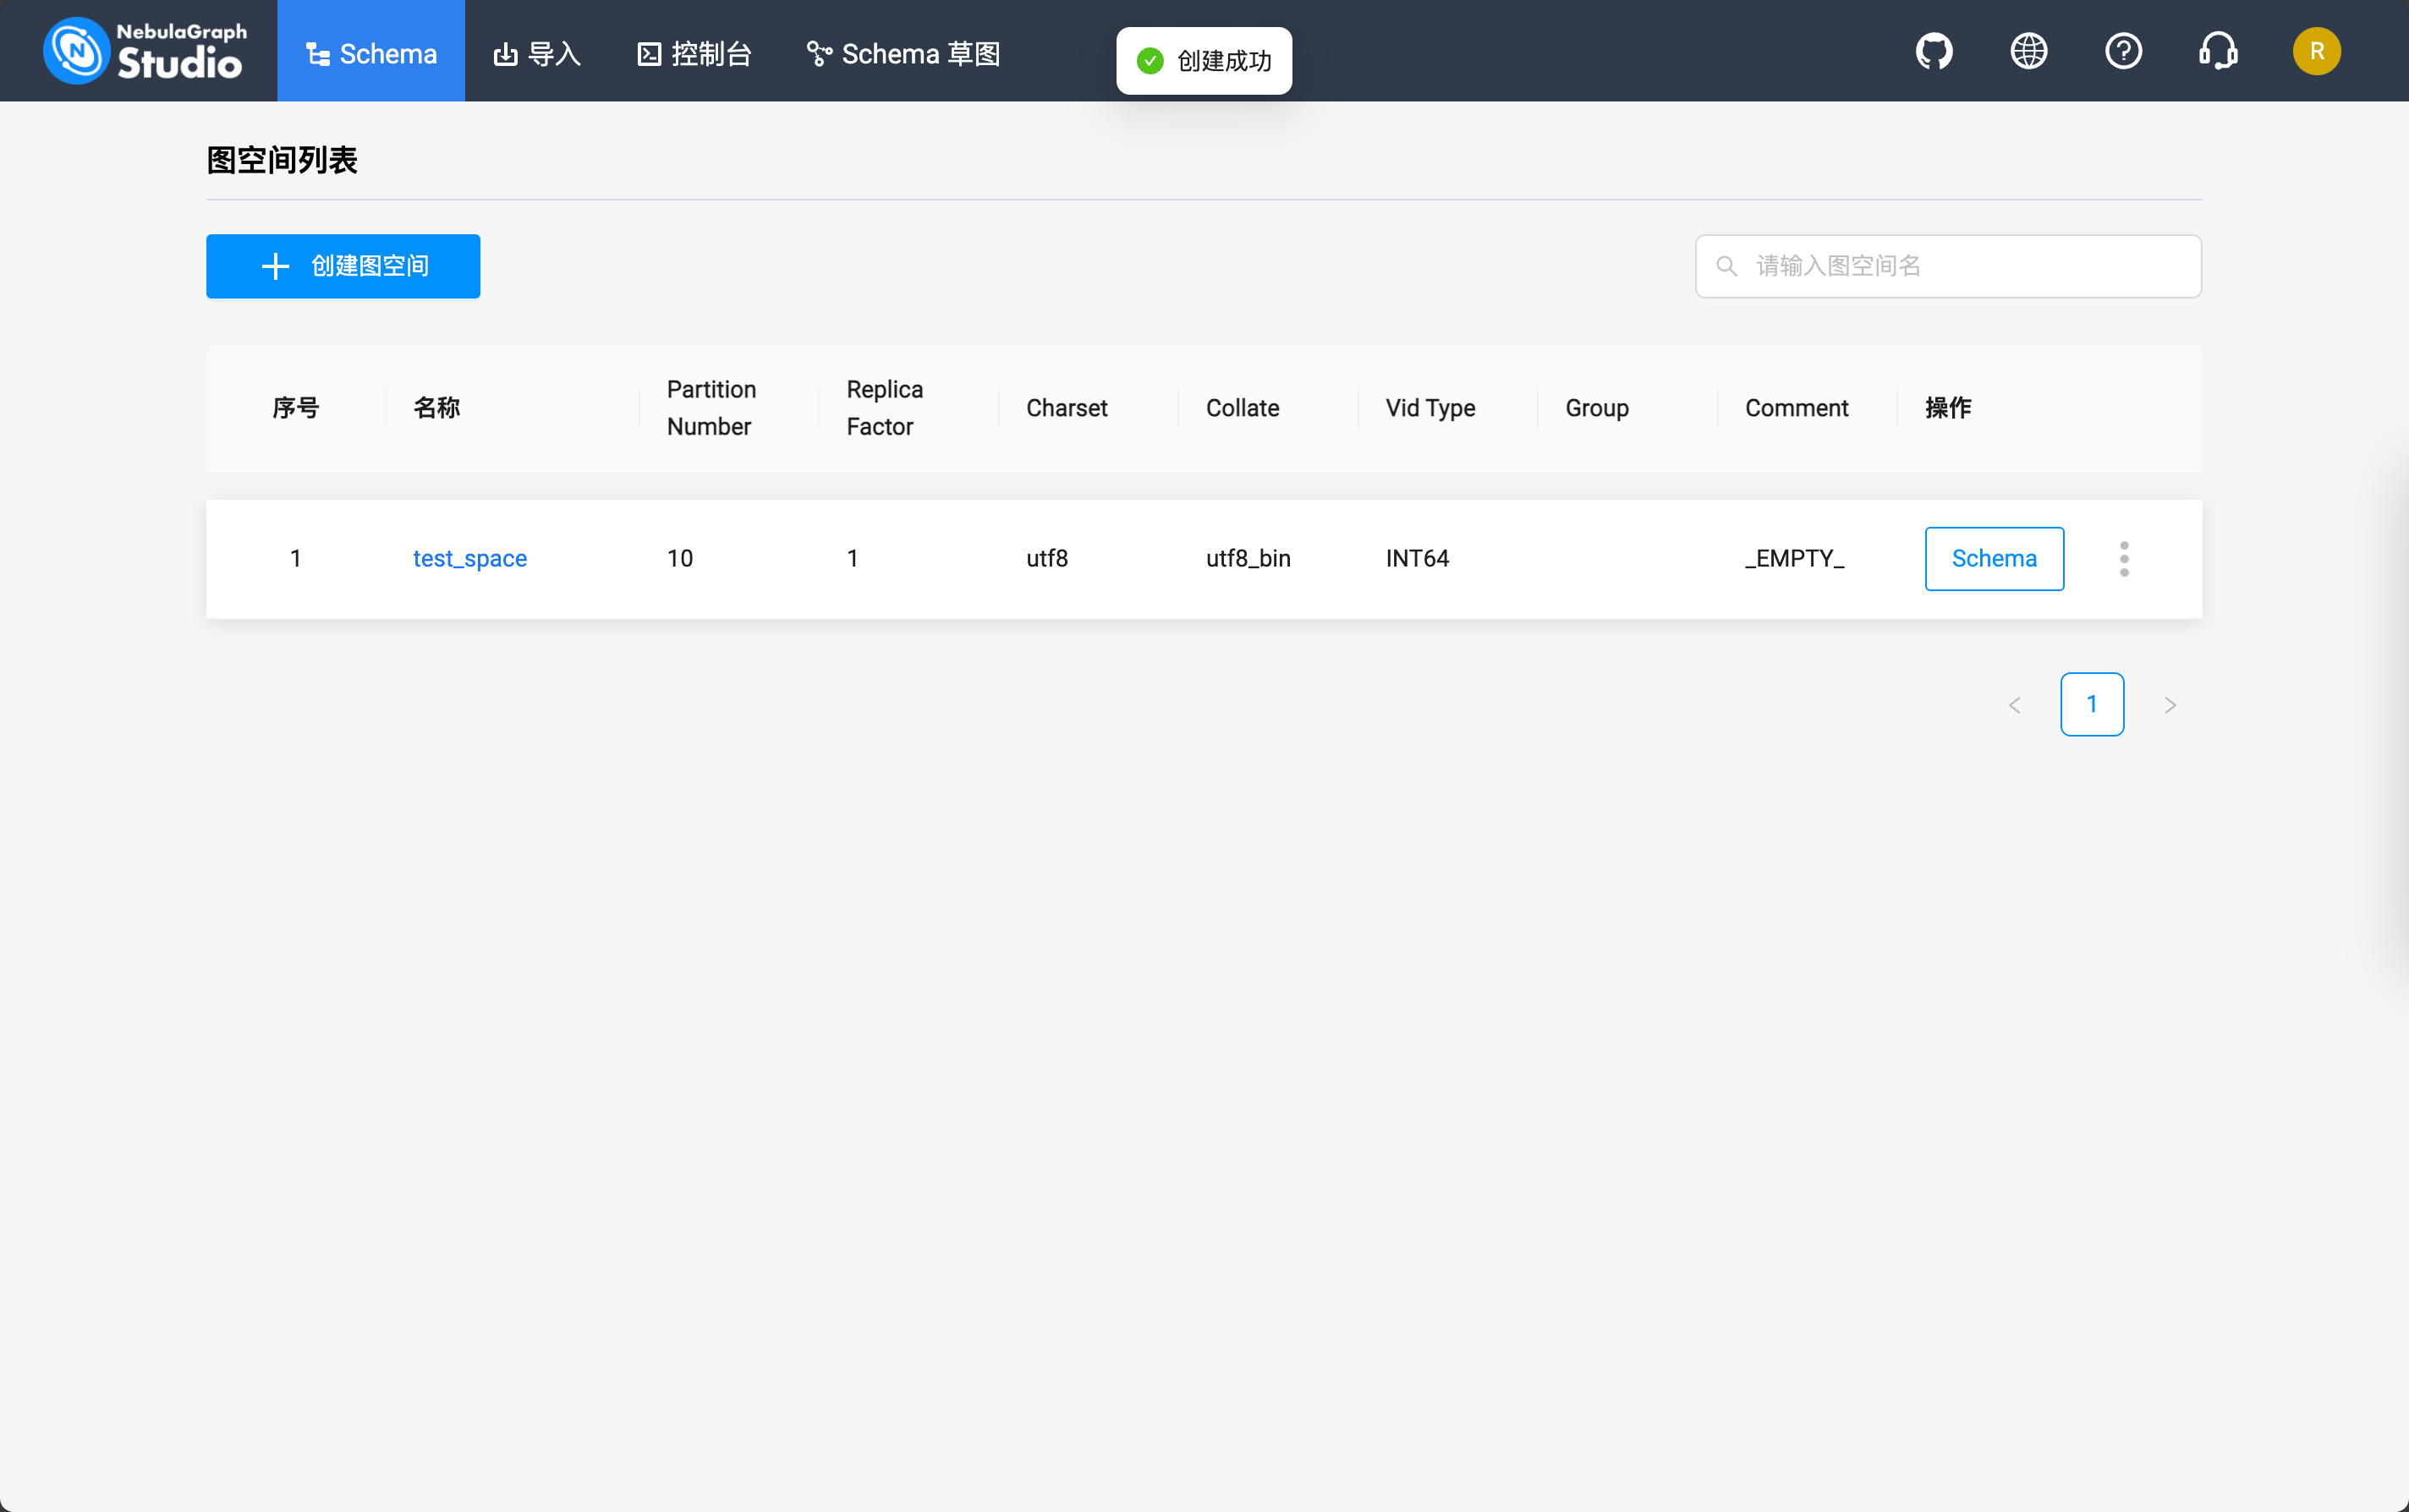
CREATE SPACE `test_space` (partition_num = 10, vid_type = INT64)创建完成之后应该是这样的:

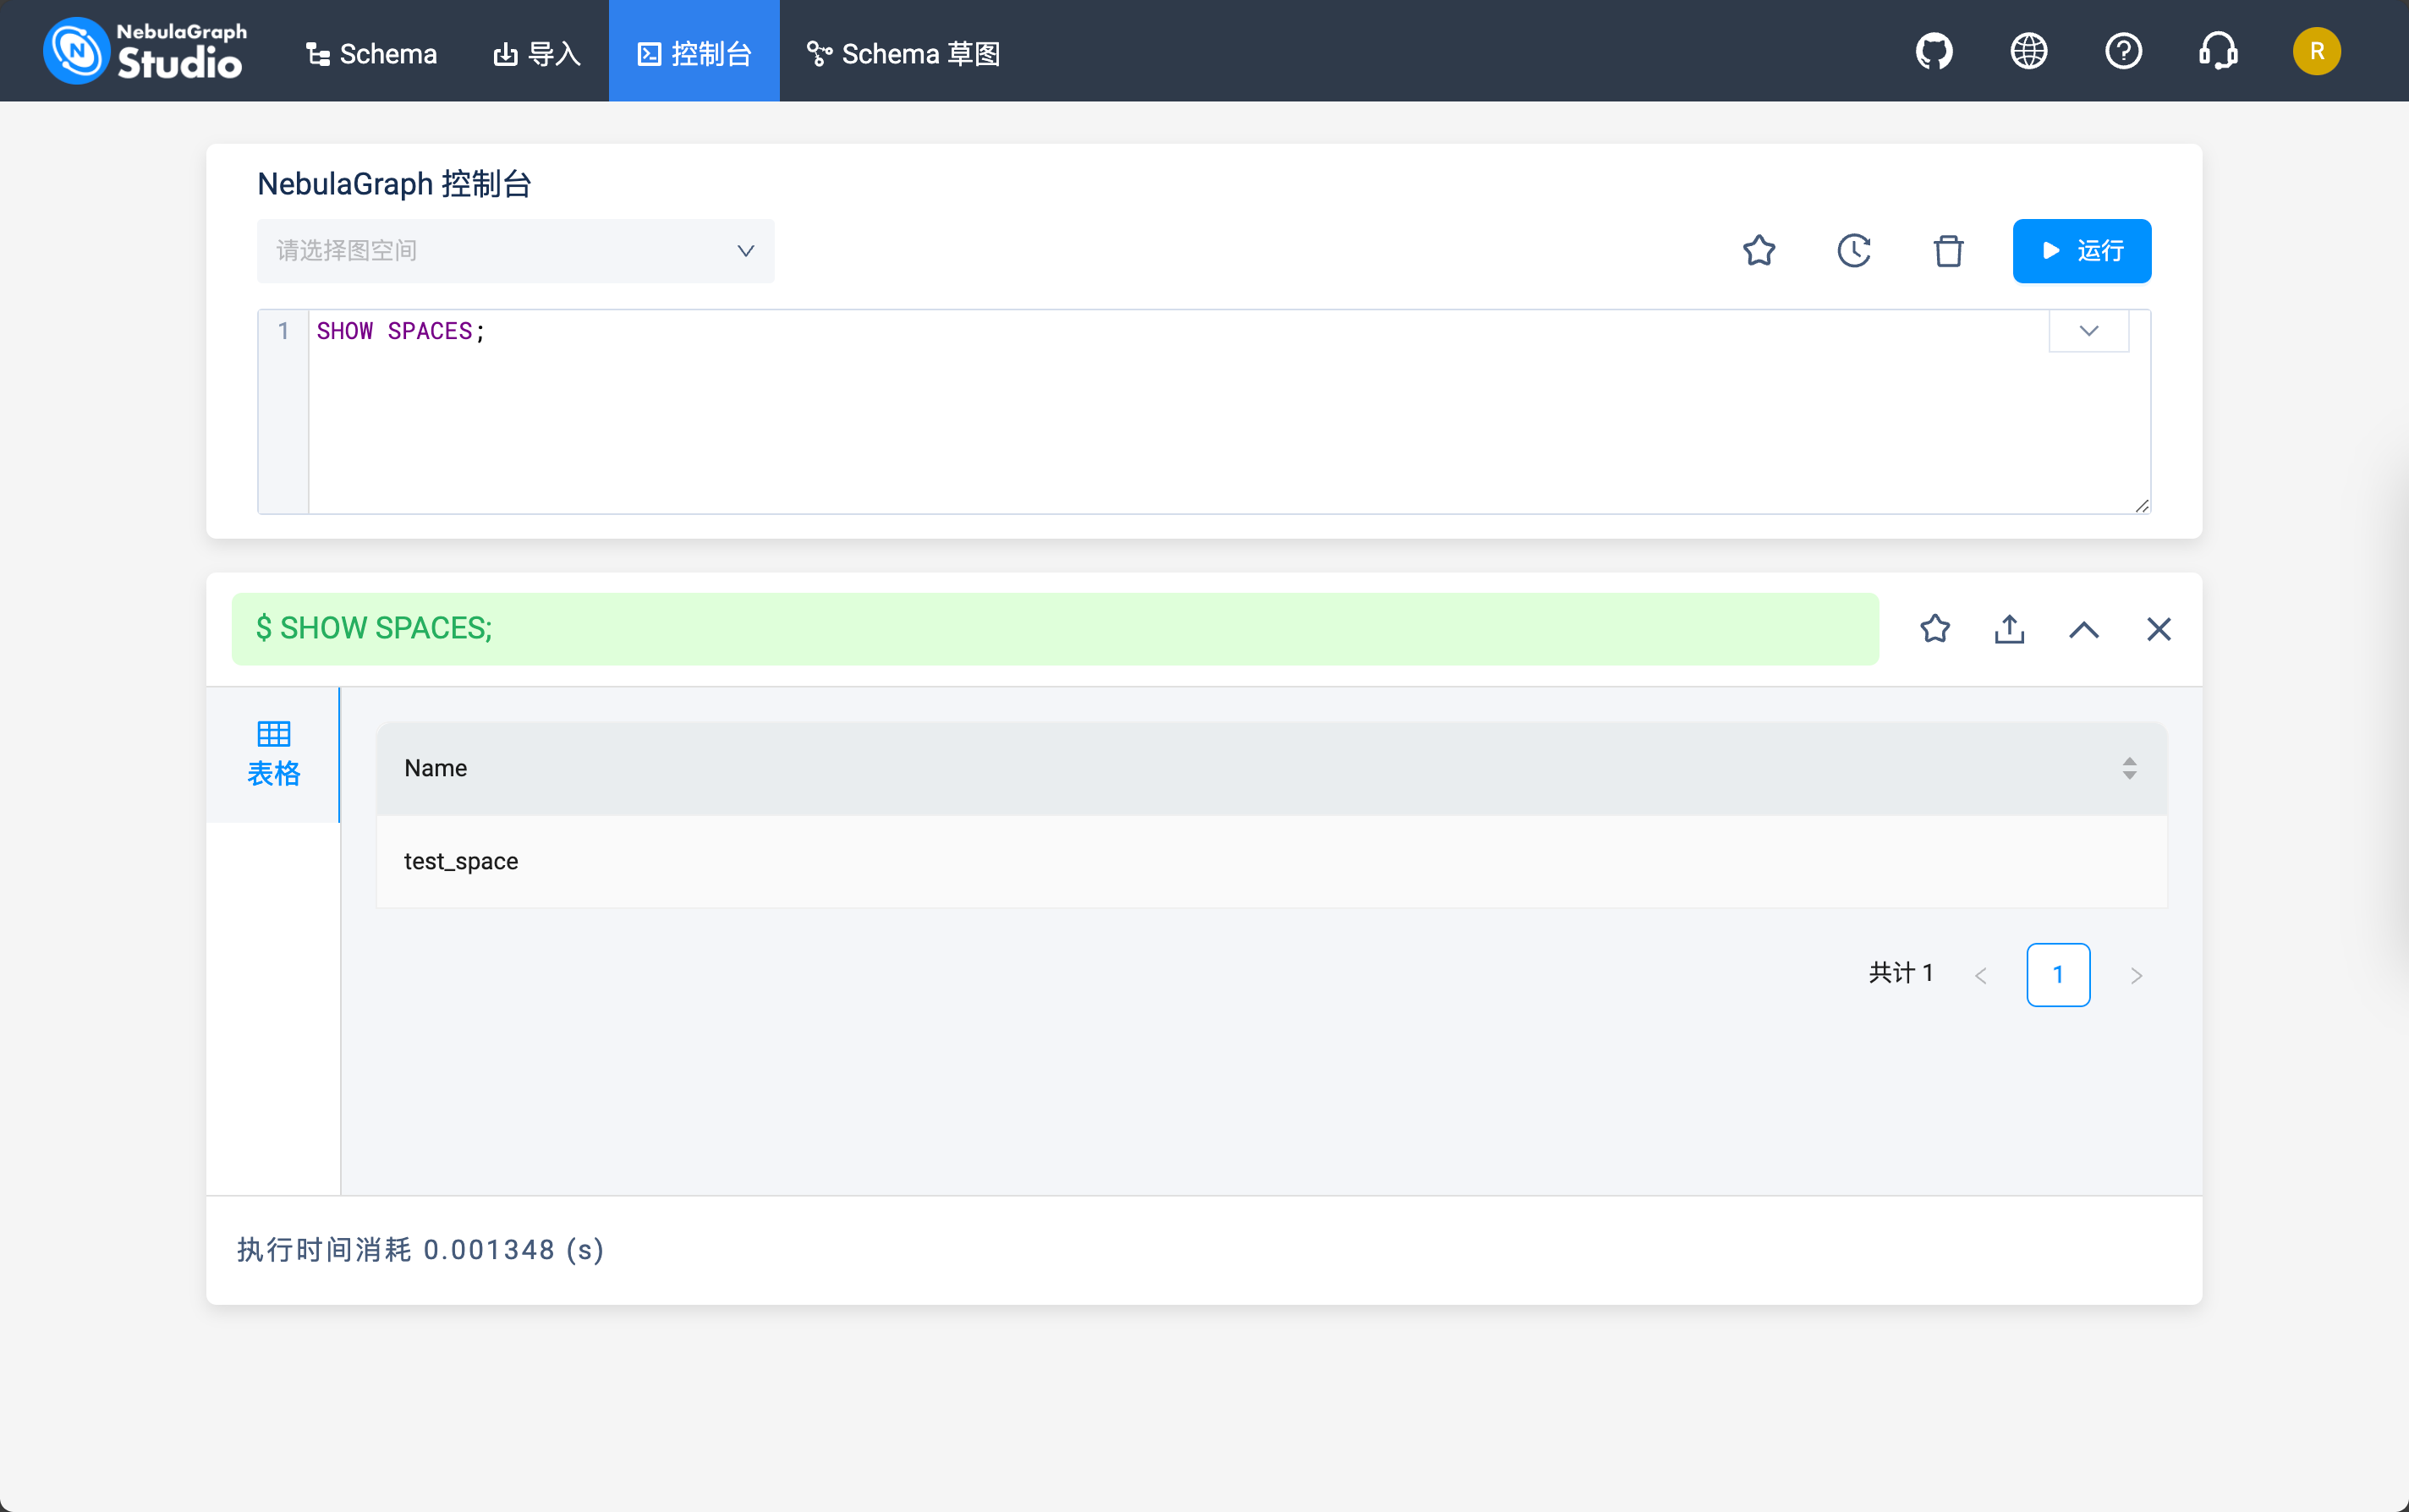
然后到「控制台」标签页就可以通过下面的命令查看当前的 NebulaGraph 中存储的图空间了:
SHOW SPACES;
 絢香猫
絢香猫